Country: Greece
Regional Innovation Scoreboard 2023
Voreio Aigaio (EL41) is an Emerging Innovator +. Innovation performance has increased over time (10.6%).
The first 21 rows and two data columns in the table on the left show the values and the normalised scores per indicator. The last two data columns show relative performance of the normalised scores compared to Greece and the EU. The next 7 rows show the calculation of the Regional Innovation Index (RII), the RII relative to both Greece (72.3) and the EU (57.5) in 2023, the RII in 2023 relative to the EU in 2016 (62.4), and the RII in 2016 relative to both Greece (80.8) and the EU in 2016 (51.7). The last row shows performance change between 2016 and 2023 compared to Greece (-8.5%) and to the EU (10.6%).
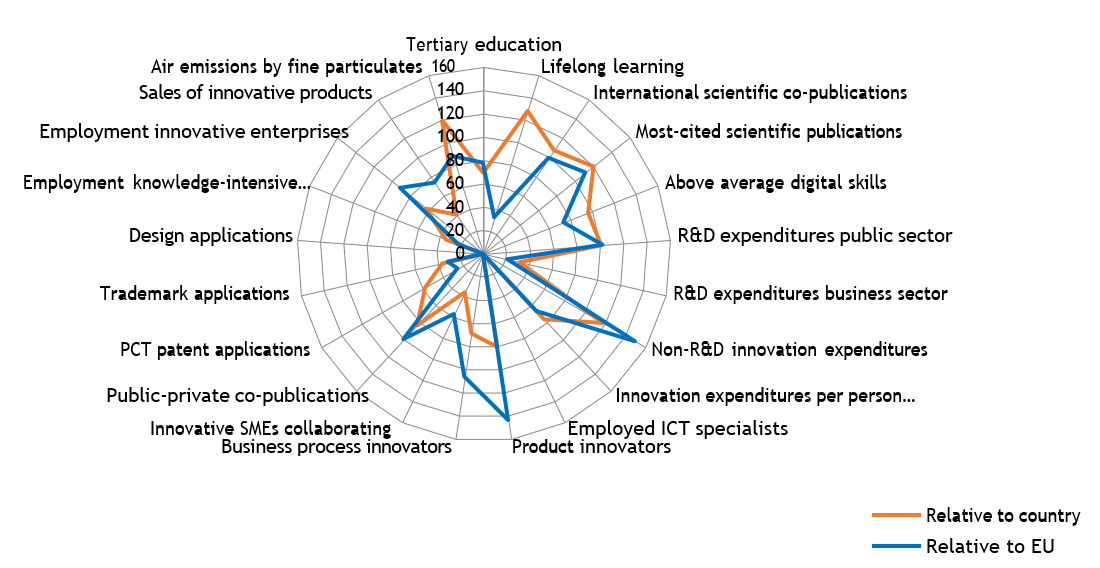
The radar graph shows relative strengths compared to Greece (orange line) and the EU (blue line), showing relative strengths (e.g. Non-R&D innovation expenditures) and weaknesses (e.g. Design applications).
The table below shows data highlighting possible structural differences, e.g. Employment in Agriculture & Mining (above EU average) and GDP per capita growth (below EU average).

EL41 – North Aegean
| Data | Normali sed score | Relative to | |
EL | EU | |||
Tertiary education | 36.0 | 0.410 | 69 | 78 |
Lifelong learning | 4.2 | 0.121 | 128 | 33 |
International scientific co-publications | 1265 | 0.305 | 107 | 99 |
Most-cited scientific publications | 1079.1 | 0.611 | 120 | 112 |
Above average digital skills | 21.1 | 0.347 | 96 | 74 |
R&D expenditures public sector | 0.81 | 0.582 | 101 | 102 |
R&D expenditures business sector | 0.07 | 0.145 | 32 | 22 |
Non-R&D innovation expenditures | ± | 0.606 | 118 | 150 |
Innovation expenditures per person employed | ± | 0.404 | 76 | 67 |
Employed ICT specialists | n/a | n/a | n/a | n/a |
Product innovators | ± | 0.802 | 80 | 144 |
Business process innovators | ± | 0.688 | 69 | 107 |
Innovative SMEs collaborating | ± | 0.279 | 36 | 57 |
Public-private co-publications | 138.3 | 0.392 | 83 | 100 |
PCT patent applications | 0.21 | 0.156 | 57 | 25 |
Trademark applications | 2.30 | 0.154 | 36 | 31 |
Design applications | 0.00 | 0.000 | 0 | 0 |
Employment knowledge-intensive activities | 6.9 | 0.128 | 34 | 23 |
Employment innovative enterprises | ± | 0.520 | 62 | 91 |
Sales of innovative products | ± | 0.354 | 41 | 74 |
Air emissions by fine particulates | 12.7 | 0.526 | 120 | 88 |
|
|
|
|
|
Average normalised score | — | 0.376 | — | — |
Country EIS-RIS correction factor | — | 0.836 | — | — |
Regional Innovation Index (RII) 2023 | — | 0.315 | — | — |
Performance 2023 relative to EU in 2023 | — | — | 72.3 | 57.5 |
Performance 2023 relative to EU in 2016 | — | — | — | 62.4 |
Regional Innovation Index (RII) 2016 | — | 0.261 | — | — |
Performance 2016 relative to EU in 2016 | — | — | 80.8 | 51.7 |
Performance change over time | — | — | -8.5 | 10.6 |
| EL41 | EL | EU |
Share of employment in: |
|
|
|
Agriculture & Mining (A-B) | 16.4 | 11.5 | 4.4 |
Manufacturing (C) | 4.1 | 9.7 | 16.4 |
Utilities & Construction (D-F) | 4.4 | 5.2 | 8.3 |
Services (G-N) | 58.2 | 64.3 | 63.7 |
Public administration (O-U) | 16.9 | 9.3 | 7.2 |
Average number of employed persons per enterprise |
n/a |
3.8 |
5.1 |
GDP per capita (PPS) | 13,500 | 20,700 | 32,400 |
GDP per capita growth (PPS) | -0.9 | 1.4 | 2.5 |
Population density | 60 | 81 | 106 |
Urbanisation | 41.2 | 74.3 | 75.8 |
Population size (000s) | 230 | 10,680 | 447,210 |
Source: EU-statistics
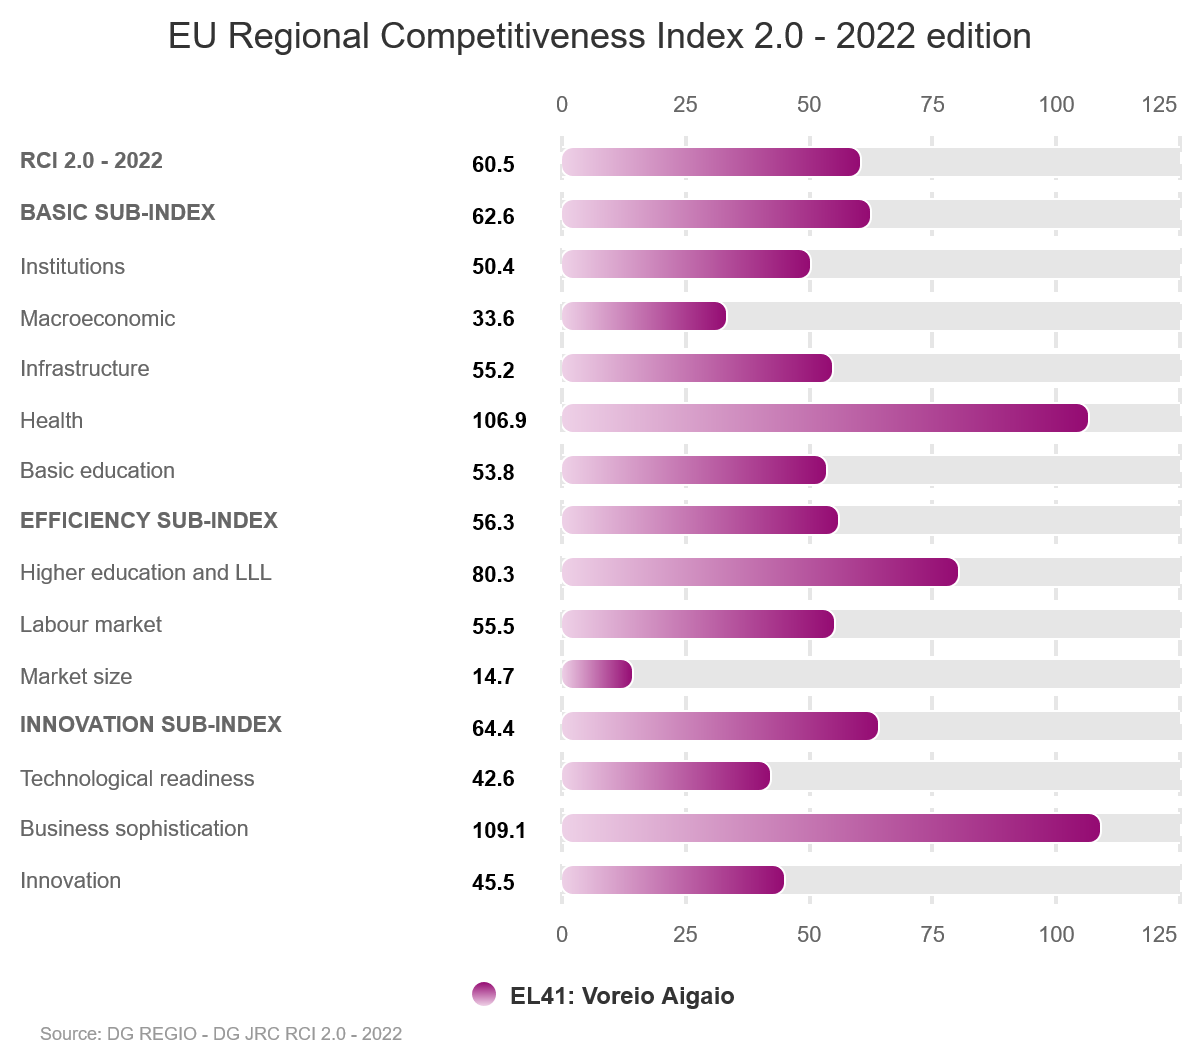
EU Regional Competitiveness Index 2.0 - 2022 edition
The EU Regional Competitiveness Index depicts basic, sufficiency and innovation indexes per ERUA region.
Source: EU-maps and statistics